

What drives Renewable Energy?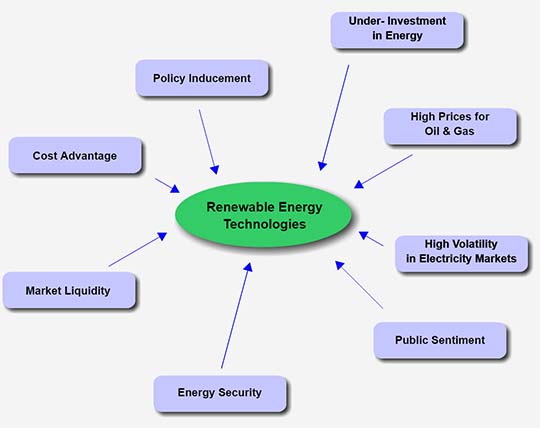
While the demand for energy is forecast to grow by 2.5% annually (source: EIA), renewables will grow faster, ultimately increasing their share of the total. What is driving demand for renewables? Public PolicyPerhaps the most powerful driving force is a favourable public policy towards renewable energy. Without policy inducement, the only renewable sources used are hydro (for electricity) and biomass. Driven by pressure to combat climate change, many governments have introduced incentive schemes to attract investment in new technologies, which would otherwise not be developed. Officially announced targets further help governments to commit.Under-Investment in EnergyAfter decades of under-investment in the energy industry, many power plants are near their end of life. This could amount to 5% of existing capacity that needs to be replaced every year on top of new builds to meet the growth in demand. | ||
High Prices for Oil & GasWith growing demand for energy, there is a risk of sustained rises in the prices for oil and gas, not just increased volatiliy. Renewable energy plants rely very little on these commodities.Volatiliy in Electricity MarketAs demand for electricity fluctuates and as supply and demand have to be kept in balance at all times, electricity prices tend to be very volatile. A larger share of renewables in the electricity mix may help in reducing that volatility, as there is little marginal cost to run a renewable energy plant.Public SentimentWith high oil prices and climate change on everybody's mind, there is increasing public support for renewable energy. According to a survey 69% of all Germans and an impressive 65% of all Germans that live near wind farms do support wind farms. While public support does not attract many investors by itself, it is crucial in obtaining building permissions. |
Energy DependenceVery few of the developed countries can cover their primary energy needs from their own resources. For instance, the EU's 27 countries import more than half from outside the EU. Apart from exposure to commodity price risk, this dependence can cause political friction. Renewable energies help decrease that dependence.Market LiquidityThanks to attractive feed-in tariffs, renewable power plants have become projects with stable cash flows, attracting investors outside the traditional energy industry that would not invest in traditional power stations that cannot be easily sold.Cost AdvantagesOf course, in some locations, renewables do not require incentives, as they are the energy of choice already, as is the case with hydro energy in large parts of South America. In addition, all renewable energies have very low marginal costs. I.e. once a solar park has been built, there is no additional variable cost involved to generated electricity. |
|
Growth in RenewablesWithin the segment of renewable fuels for electricity generation, wind and solar energy have been among the fastest growing technologies. Despite a recession, 2009 has seen an unprecedented new build of 35GW wind and 6.5GW photovoltaics worldwide. The growth, however, has not been universal. In recent years we have seen a big shift from Europe to Asia, Middle East and, increasingly, Africa. |
||
Mature vs Growth Markets
How do we know if a market is mature or booming? To answer this question, we have plotted countries according to relative growth in capacity during 2009 against the country's total specific capacity.. The specific total capacity is the installed total capacity divided by the total energy consumed by the country in one year. I.e., this is the amount of wind capacity relative to the country's electricity consumption. For example, the U.S. has more wind capacity than Germany, yet its specific capacity is much lower, as the U.S. consumes more electricity. In the wind segment (in 2009), we found all countries along a traditional maturity curve. Growth slows down in saturated markets, such as Denmark and Germany, whilst China has seen phenomenal growth from its lower base. If we plotted this curve in 2020, China, would have moved along the curve to the mature markets. In the photovoltaic segment, the market in 2008 was much more concentrated on very few countries - Germany and Spain in particular. As the diagram highlights vividly, Spain looks like the odd one out. It's no surprise therefore that Spain reverted back to single digit growth in 2009 having reneged on payments to solar farms. This type of analysis can not just highlight growth markets, but also point to risks. |
||
Join us
|
Join us on Linkedin
Subscribe to our blog
Follow us on Twitter
Follow us on Facebook
|
<< previous | next >> |
|
| About | Terms of Use | Sitemap | Contact Us | ©2016 Green Rhino Energy Ltd. |